Biography

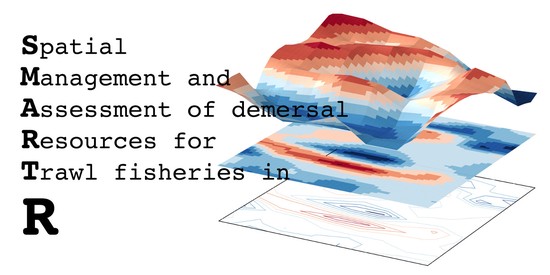
My PhD thesis, ‘Spatial Models for Fisheries Management – Effort, Resources, Environment’, covers the model and the software tool SMART, used to examine the distribution of the demersal resources and the fishing effort; evaluate the current biological production and exploitation patterns; assess the impact of possible administration strategies to put in place simulating different management scenarios. I am also one of the authors of the R-package VMSbase, a platform allowing processing and analysing VMS, AIS and Logbook data. I am working on the fisheries science subjects from four years now, and I am being involved in different European projects, fully aware of the growing need of an international, interdisciplinary and connected network of scientist to be engaged on the assessment and management of our shared marine resources for their sustainable development and conservation for the future generations.

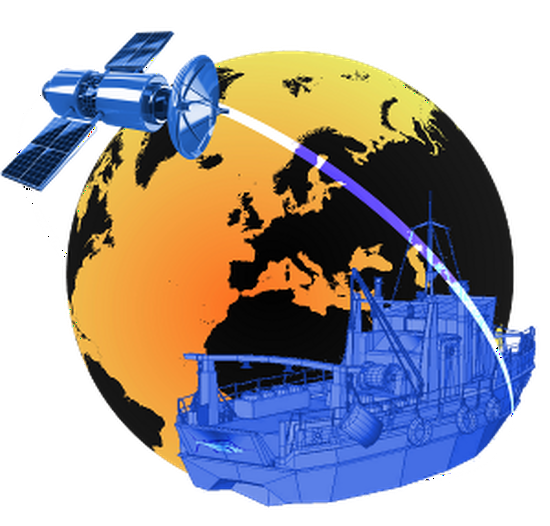
Management of catches, effort and exploitation pattern are considered the most effective measures to control fishing mortality and ultimately ensure productivity and sustainability of fisheries. Despite the growing concerns about the spatial dimension of fisheries, the distribution of resources and fishing effort in space is seldom considered in assessment and management processes. Nowadays, different tracking devices can be used to record the activity of fishing vessels in space and time and to analyze the pattern of fishing effort with respect to sea substrates, resources, or socio-economics factors. Among these devices, the Vessel Monitoring System (VMS) and the Automatic Identification System (AIS) represent the most interesting and fertile data sources for fisheries investigations. The development of state-of-the-art models based on this kind of data can provide an effective way to implement ecosystem approach to fisheries.

Interests

  • Ecology
  • Bioinformatics
  • Conservation
  • Artificial Intelligence

Education

  • Ph.D. in Evolutionary Biology and Ecology, 2017

    Tor Vergata University of Rome

  • M.Sc. in Bioinformatics, 2012

    Tor Vergata University of Rome

  • B.Sc. in Ecology, 2010

    Tor Vergata University of Rome

Skills

Recent Publications

Quickly discover relevant content by filtering publications.

Experience


MINOUW project

Horizon 2020 Framework Programme of the European Union

Jun 2017 – Jun 2019

Applying science, innovation and partnership to reduce discards in European fisheries. MINOUW encourage the adoption of fishing technologies and practices that reduce unwanted catches, and contribute to the elimination of discards in European fisheries.

  • Implementation of a Data- and Knowledge- base of the fishery
  • Development of a web-GIS platform for data analysis and dissemination


MANTIS project

European Commission – DG Maritime Affairs and Fisheries (DG MARE)

Jun 2016 – Jun 2017

Marine protected areas network for enhancement of sustainable fisheries in EU Mediterranean waters. Responsibilities include:

  • Spatial-based Approach to the Management of Fishing Effort
  • Simulation of Management Scenarios


RITMARE project

National Research Programmes of the Italian Ministry of University and Research

Jun 2013 – Jun 2016

RITMARE supports integrated policies for the safeguard of the environment (the health of the sea); enables sustainable use of resources (the sea as a system of production); implements a strategy of prevention and mitigation of natural impacts (the sea as a risk factor).

  • Analysis of Satellite Data (VMS/AIS)
  • Development of Bio-Economic Models

Projects

*

smartR

Spatial MAnagement of demersal Resources for Trawl fisheries

vmsbase

process and visualize fishing vessels activity

Minouw

Elimination of discards in European marine fisheries

Mantis

Marine protected Areas Network Towards Sustainable fisheries.

Accomplish­ments

AMARE-MED 2019: Advanced school on quantitative methods for ecosystem approach to fisheries application

Climate-Enhanced Age-based Model with Temperature-Based Trophic Linkages and Energetics (CEATTLE) by Andrè Punt (School of Aquatic and Fishery Sciences, University of Washington – USA). FishPath by Natalie Dowling (Oceans and Atmosphere in Hobart, Tasmania - Australia). CMSY by Gianpaolo Coro (Istituto di Scienza e Tecnologie dell’Informazione A. Faedo - CNR, Italy).

PH125.4x: Data Science: Inference and Modeling

Statistical inference and modeling are indispensable for analyzing data affected by chance, and thus essential for data scientists. In this course, you will learn these key concepts through a motivating case study on election forecasting. This course will show you how inference and modeling can be applied to develop the statistical approaches that make polls an effective tool and we’ll show you how to do this using R. You will learn concepts necessary to define estimates and margins of errors and learn how you can use these to make predictions relatively well and also provide an estimate of the precision of your forecast. Once you learn this you will be able to understand two concepts that are ubiquitous in data science: confidence intervals, and p-values. Then, to understand statements about the probability of a candidate winning, you will learn about Bayesian modeling. Finally, at the end of the course, we will put it all together to recreate a simplified version of an election forecast model and apply it to the 2016 election.

PH125.3x: Data Science: Probability

The motivation for this course is the circumstances surrounding the financial crisis of 2007-2008. Part of what caused this financial crisis was that the risk of some securities sold by financial institutions was underestimated. To begin to understand this very complicated event, we need to understand the basics of probability. We will introduce important concepts such as random variables, independence, Monte Carlo simulations, expected values, standard errors, and the Central Limit Theorem. These statistical concepts are fundamental to conducting statistical tests on data and understanding whether the data you are analyzing is likely occurring due to an experimental method or to chance. Probability theory is the mathematical foundation of statistical inference which is indispensable for analyzing data affected by chance, and thus essential for data scientists.

PH125.2x: Data Science: Visualization

This course covers the basics of data visualization and exploratory data analysis. We will use three motivating examples and ggplot2, a data visualization package for the statistical programming language R. We will start with simple datasets and then graduate to case studies about world health, economics, and infectious disease trends in the United States. We’ll also be looking at how mistakes, biases, systematic errors, and other unexpected problems often lead to data that should be handled with care. The fact that it can be difficult or impossible to notice a mistake within a dataset makes data visualization particularly important. The growing availability of informative datasets and software tools has led to increased reliance on data visualizations across many areas. Data visualization provides a powerful way to communicate data-driven findings, motivate analyses, and detect flaws. This course will give you the skills you need to leverage data to reveal valuable insights and advance your career.

Training course on Stock Assessment

The general objective of the course is to train stock assessment scientists in basic population dynamics and stock assessment. The course not only presents the theoretical elements but also puts theory into practice through case studies and hands-on exercises. Specific objectives are: understanding the role of stock assessment in fishery science; familiarity with conventional stock assessment models; experience in basic model building and parameter estimation. By the end of the course, the participants will: be aware of single species assessment methods as applied to North Atlantic fisheries; understand the data-collection needs for different assessment methods; be familiar with indicators and reference points, both biological and economic, as tools in fishery management; develop knowledge of population and fishery processes by using simulation models to improve scientific advice for managers.

15.071x: The Analytics Edge

In the last decade, the amount of data available to organizations has reached unprecedented levels. Data is transforming business, social interactions, and the future of our society. In this course, you will learn how to use data and analytics to give an edge to your career and your life. We will examine real world examples of how analytics have been used to significantly improve a business or industry. These examples include Moneyball, eHarmony, the Framingham Heart Study, Twitter, IBM Watson, and Netflix. Through these examples and many more, we will teach you the following analytics methods: linear regression, logistic regression, trees, text analytics, clustering, visualization, and optimization. We will be using the statistical software R to build models and work with data. The contents of this course are essentially the same as those of the corresponding MIT class (The Analytics Edge). It is a challenging class, but it will enable you to apply analytics to real-world applications.

Contact

  • Via Cracovia, Roma,
  • L.E.S.A. Laboratory of Experimental Ecology and Aquaculture